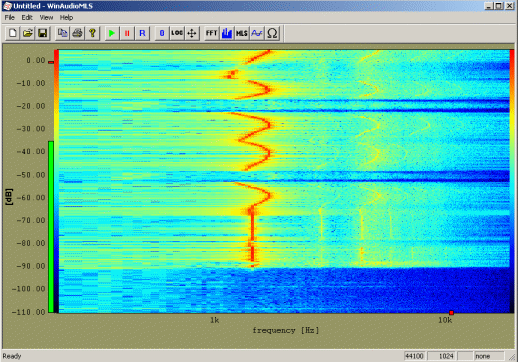
The spectrogram is a powerful tool to analyze a signal combined in the time and frequency domain. It allows to monitor the spectral components over a period of time in a single plot. Each line in the spectrogram corresponds to the spectrum at one time period. The level at each frequency is shown with a color. On the left and right site of the plot is a color bar helping to identify the level. The precise level can be measured with the cursor.

At an adjustable time period the spectrogram is updated. All existing lines are moved and a new line is appended.
For printing on a monochrome printer, there is also a grayscale color map.