Vectorscope / Goniometer / Phasemeter
The Vectorscope also known as a
Goniometer is a powerful and widely used tool for monitoring stereo signals.
Originally it came from traditional analog oscilloscope. The first channel is
send to the x-input the other channel is send to the y-axis input.
With little training this display
gives a fast overview of a stereo signal and the phase relation between the
channels. The picture below shows a typical example for music.
Features
|
Dot or line display |
|
|
Persistent display with fading effect |
|
|
Adjustable decay time |
|
|
Free rotation |
|
|
Free size of display |
The display is optimized for fast
attack times combined with a maximum of information. Instead of single pixels
you can activate lines with a special persistent view. In contrast to analog
oscilloscope you can even adjust the persistent time. We use a special
exponential decay profile.
You can rotate the display by +45 or
-45 degrees or with an arbitrary angle. With these optional rotations, mono
signal are on the main axis.
With the multi channel features of
WinAudioMLS you can monitor up to 32 stereo pairs simultaneously. You can
combine it freely with normal spectral displays.
With the channel matrix you can assign
all available channels to each vector display.
The Vectorscope display is freely
scalable.
This dialog box shows the
configuration for the Vectorscope.
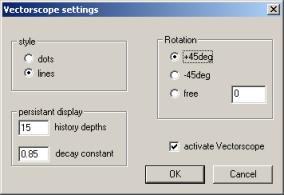
For several signal scenarios you get
typical Vectorscope displays. All example displays were generated with no
rotation.
1.1.1
Both channels zero
For a zero signal you get a single dot
in the middle of the display.
1.1.2
First channel zero
If the first channel is zero, all
display dots are on the y-axis.

1.1.3
Second channel zero
If the second channel is zero, all
display dots are on the x-axis.
1.1.4
Mono signal
If both channels are identical, the
signal dots are on the diagonal line.
1.1.5
Signal with 3dB level difference
If the level differs between both
channels, the signal dots are on a single line with a different angle. The
following example has level difference of 3dB between both channels.
1.1.6
Signal with 180 degree phase difference
If both channels have a phase
difference of 180 degree, you get the following plot.
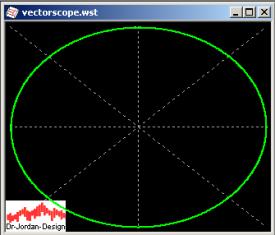
1.1.7
Lissajous figures
With sine signals as input you can
view the famous Lissajous figures. If the phase shift is exactly 90 degrees, you
get a circle. This figure is very sensitive to frequency or phase
variations between both channels. Such figures are widely used for e.g.
azimuth adjustment of tape recorders.